Top 6 TI-84 Family Calculator Functions You Need To Know for AP® Statistics
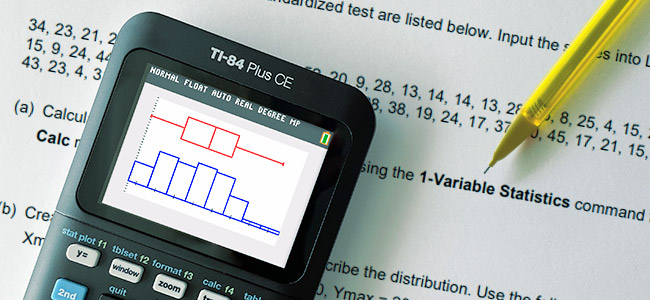
The AP® Statistics exam is just around the corner, and there is a lot to learn for this rigorous test. We're here to help you prioritize your efforts.
As you may know, some questions on the AP® Statistics exam will require the use of a calculator to perform a statistical test, compute a probability, or display a graph. With so much to know about the course and your graphing calculator’s functions, where should you focus your study time?
As a former AP® Statistics teacher, I've compiled a list of the most important statistics features to know for the TI-84 Plus CE graphing calculator. These are not just your random tips, but functions you will be asked to do during the exam.
If you are taking the AP® Statistics exam in May, check out the top 6 must-know tips about your TI-84 Plus CE:
- Regression Analysis
- Normal Probabilities
- Binomial Probabilities
- Random Variables
- Checking Conditions
- Inferential Procedures

1: Regression Analysis
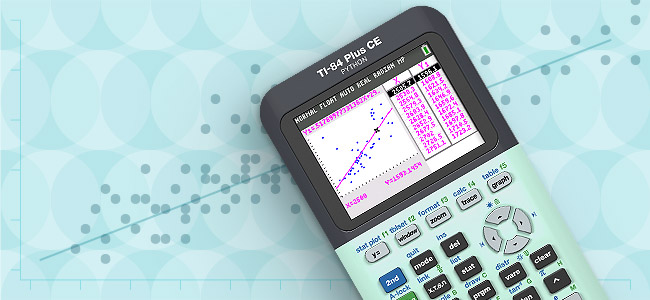
While it’s unlikely that you will be asked to draw a scatterplot on the exam, being familiar with how to create and analyze a scatterplot of bivariate data could prove crucial. You may be given a scatter plot to analyze and you will want to know how to quickly interpret the slope, the x/y intercept, the correlation and the coefficient. You can use LinReg (a+bx) to get this information.
How to make a regression model:
- Turn on diagnostics: mode
- Enter data in the list editor: stat, 1: Edit
- Turn on scatter Plot1: 2nd , y =
- Choose the scatter plot icon under Type
- Check your data: zoom, 9: ZoomStat
- Choose a regression model: Stat, CALC, 8: LinReg (a+bx)
- Store your equation under Store RegEQ: alpha, trace, 1: Y1
- Select Calculate: enter
- Now you have the data
- Don’t forget to check the residual plot
- Turn off scatter Plot 1 and turn on Plot2: 2nd , y =
- On Plot2, change Ylist to RESID: 2nd, stat
- Check your data: zoom, 9: ZoomStat
- If the residual plot shows no pattern, then the regression model is a good fit
- To see the line of fit, turn off Plot2, turn on Plot 1: 2nd , y =
- When in Plot 1: zoom, 9: ZoomStat

2: Normal Probabilities
Every AP® Statistics exam has had a normal distribution question on it. The computation of probabilities for random variables that are normally distributed is a core concept in the AP® Statistics course. Because of this, you can expect a question involving a normal probability computation on the exam.
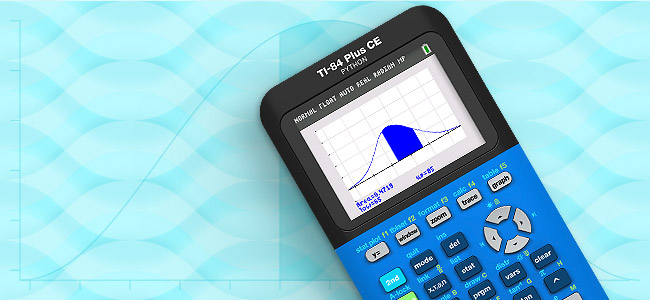
Let’s say you are asked to find the probability that X takes a value between 65 and 86 if X is normally distributed with mean 70 and standard deviation 15. A helpful tool for this type of question is the command normalcdf( on your calculator.
The command normalcdf( takes inputs of the mean, standard deviation, and a lower and upper boundary. This is helpful because it means you do not need to standardize the values (turn to z-scores) before using the command. And, since you are allowed boundary values, you also don’t have to apply the complement rule.
How to calculate a normal distribution:
- Use the normalcdf( command: 2nd, vars, 2: normalcdf(
- Input the lower boundary, upper boundary, mean and standard deviation data in the wizard
- Select Paste: enter
- Calculate the command: enter
How to graph a normal distribution:
- Set up your window: window
- Use the ShadeNorm( command: 2nd, vars, DRAW, 1: ShadeNorm(
- Input the lower boundary, upper boundary, mean and standard deviation data in the wizard
- Select Draw: enter


3. Binomial Probabilities
You're probably familiar with the verbal cues to recognize when a question is about a binomial context, but do you know which probability menu item to use for any given situation? Which commands should you use for a single versus a multiple outcome probability? The commands binompdf( and binomcdf( are helpful when used in the right scenario.
Single outcome probability
What’s the probability of exactly 5 heads in 10 coin flips? (Hint: It is not 1/2.) This question asks for the probability of a single outcome. For a single outcome probability, you should use the binompdf( command.How to calculate a single outcome probability:
- Use the binompdf( command: 2nd, vars, A: binompdf(
- Input the number of trials, probability of success and number of successes into the wizard
- Select Paste: enter
- Calculate the command: enter
Multiple outcome probability
What’s the probability of more than 5 heads in 10 coin flips? This question asks for the probability of multiple outcomes. For this scenario, you want to use the binomcdf( command.How to calculate a multiple outcome probability:
- Use a binomcdf( command: 2nd, vars, B: binomcdf(
- Input the number of trials, probability of success and number of successes into the wizard
- Calculate the command: enter
- Use the complement rule to calculate the probability (if necessary)
Keep in mind that binomcdf( is cumulative from 0 to k successes, so pay close attention to whether or not to subtract the endpoint when using the complement rule.
NOTE: For the free-response section of the exam, you must show the correct work and justification for the computation. The exam readers will not accept “calculator speak” as justification (i.e. “1 - binomcdf(10,.5,5)”). You must properly label your values and output to get full credit.


4: Random Variables
On exam day, you may be asked to calculate the mean or standard deviation of a random variable given in a table. You can use a little-known feature of the 1-Var Stat command to generate the summary statistics for a random variable by putting the values of the variable in one list and the probabilities in another list.
Using this method, you can get the mean and standard deviation quickly, which saves you the time and effort of making multiple calculations.
How to calculate the mean and standard deviation of a random variable:
- Enter data in the list editor: stat, 1: Edit
- Enter values in L1
- Enter probabilities in L2
- Now select the 1-Var Stats command: stat, CALC, 1: 1-Var Stats
- List: Use the values in L1
- FreqList: Use the probabilities in L2: 2nd, 2
- Select Calculate: enter
- Mean is listed as x̄
- Standard deviation is ΣX

5: Checking Conditions
It's unlikely that will you be asked to make a graph of univariate data on the exam directly. However, you may need to check the conditions for an inferential procedure involving means. Therefore, knowing how to quickly generate a graph of data and determine its relative shape is important.
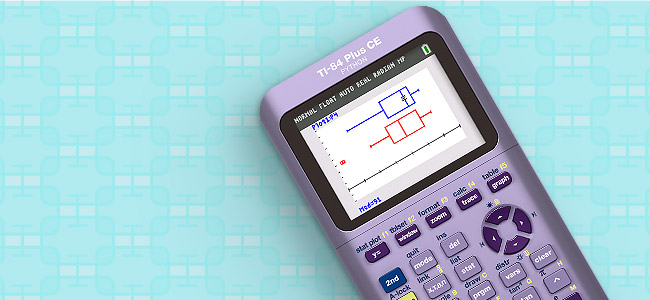
You will be asked to do inferential procedures as well as to check if the assumptions made are valid. If the inferential procedure is about means, then you will need to check the assumption of a normally distributed population. Two ways to assess the shape of a sample distribution are with a boxplot or a histogram.
How to check the conditions for an inferential procedure:
- Enter data in the list editor: stat, 1: Edit
- Enter values in L1
- If needed, enter second sample in L2
- Turn on Plot1: 2nd , y =
- Under Type, choose a graph icon in the menu
- Icon 4 is a modified boxplot or icon 3 is a histogram
- Select your icon choice and turn on: enter
- To see the graph: zoom, 9: ZoomStat

6: Inferential Procedures
As sure as the sun will rise tomorrow, you will be asked to carry out an inference procedure on the free-response portion of the exam. You may be given sample statistics to work with or perhaps a small data set to input.
Either way, you must be sure to know which type of inferential procedure to do. Here are a few tips to help.
Deciding what type procedure:
- When you see the terms “provide evidence” or “significant,” these are indications that you are being asked to test a pair of hypotheses.
- If the question says “estimate” or “confidence,” this gives an indication that an interval is appropriate to answer the question.
- Be sure to be familiar with each type of inferential procedure, including its outputs.
- T-procedures are required when dealing with questions about a population mean or difference in two population means.
How to find inference procedures on the calculator:
You will want to be familiar with the options under the Stat Tests menu. A couple of commonly used options are for proportions and chi-squared tests.Inference procedures for proportions are indicated by “Prop” in the title of the command on the calculator.
- Press the stat key, then arrow over to TESTS
- 5: 1–PropZTest
- 6: 2–PropZTest
- A: 1–PropZInt
- B: 2–PropZInt
A Chi-squared test for homogeneity has the same mathematics as a Chi-squared test for independence, so there is only one Chi-Squared test option for these tests.
- Press the stat key, then arrow over to TESTS
- For homogeneity or independence use: C: x²–Test
- For goodness of fit use: D: x²GOF–Test

Practice for exam success
As with any new skill, practice makes perfect. Becoming more familiar with these must-know tips will help you through the AP® Statistics course and exam. We recommend taking just a few minutes a day to practice one procedure at a time.
For more information on exam dates and other study materials, check out the AP® Statistics webpage on College Board's website.
You can also find more videos on our AP® Statistics playlist on YouTube.
If you're a teacher, feel free to sign up for emails and follow us on social @TIcalculators for ideas and resources you can take back to the classroom. And for students, subscribe to our YouTube channel for more tips to try out with your TI-84 Plus CE and become a calculator whizz.
About the author: Curtis Brown taught mathematics and AP® Statistics for several years and is currently the Math Segment Manager at Texas Instruments. In this role, he has led many content development projects including the "Math in Motion" series. Brown has always found joy in exploring the patterns and logic of mathematics. In his spare time, he enjoys kayaking and fishing with his sons and spending time with his family.
